
Hey, I'm Jeffrey, a software engineer interested in full-stack web development, data visualization, mapping, and the digital humanities. I currently develop interactive online mapping software at Caliper Corporation in Newton, MA.
Previously, I received my Master's in Engineering from MIT, where I studied computer science, with a concentration in Human-Computer Interaction and Data Visualization. I wrote my thesis in the MIT Media Lab (Human Dynamics Group), on an interface for improving the discoverability of text-based archival collections. I was also a Research Assistant in the Digital Humanities Lab.
Before that, I was a full-stack software engineering fellow at the U.S. Census Bureau and did my undergraduate at MIT, with a degree in computer science and minor in political science.
Portfolio
Research
2020-2022
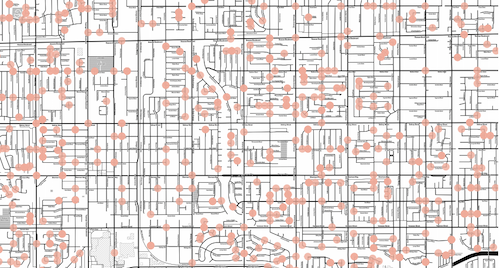
The Cop In Your Neighbor's Doorbell: Amazon Ring And The Spread of Participatory Mass Surveillance
Used spatial regression modeling and computational grounded theory to study how Amazon's Ring Neighbors platform is used nationally and, as a case study, in Los Angeles. Our paper was published in CSCW 2022, available here. Research was conducted in the MIT Media Lab's Human Dynamics group, with Dan Calacci and Alex (Sandy) Pentland.
Data Visualization
Summer 2022
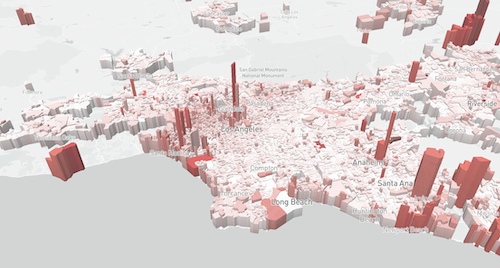
Ghost Cities
A 3D, interactive map exploring the issue of vacant housing units in the United States. Built with GIS and Mapbox.
Summer 2021
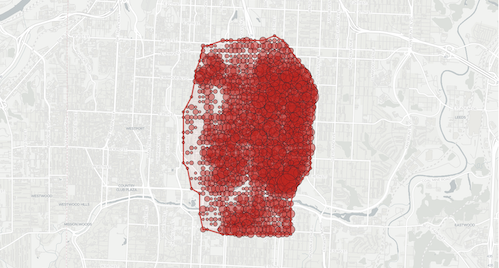
ShotSpotter in Kansas City, MO
An interactive, data visual article on how ShotSpotter acoustic gunshot detection technology is used to faciliate urban "renewal" and displacement. Work supported by the 2020-2021 Human Rights & Technology Fellowship at the MIT Center for International Studies.
2019 - 2020
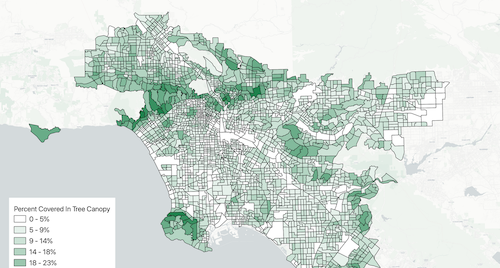
Blog
A data visualization publication covering politics, society, and culture. Example topics include mapping the inequal access to shade in Greater Los Angeles and quantifying how lyrical modern hip-hop is.
Summer 2020
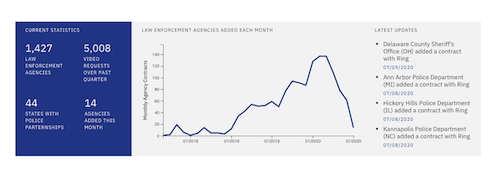
Amazon Ring's Police Partnership Tracker
Created a website monitoring the over 1,400 partnerships Amazon Ring has with local law enforcement. Built with Node.js, D3, and MongoDB.
Politics
Jan 2020 - Aug 2020
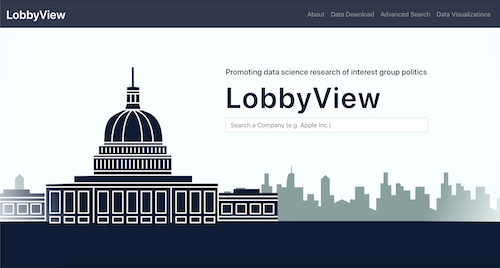
LobbyView
Worked with the MIT Political Science Department, developed interactive data visualizations using D3 and React for LobbyView, a database of Congressional lobbying that aims to facilitate political science research and bring transparency to money in politics.
2018
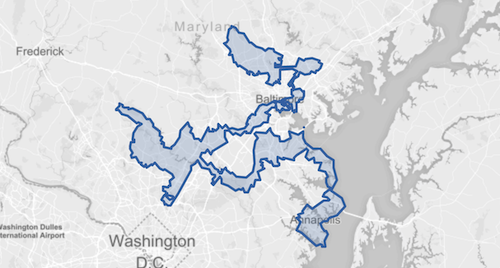
Is My District Gerrymandered?
Created an interactive website that estimates how gerrymandered a U.S. congressional district is, using geometry and election results. Project won the 2018 Congressional App Challenge in Massachusetts's 6th District.
Spring 2018
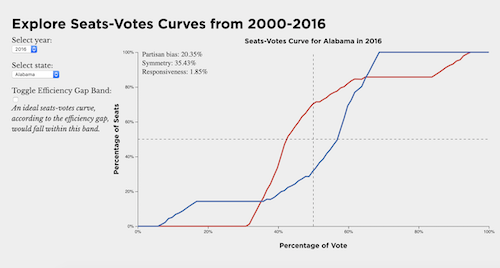
Exploring the Seats-Votes Curve
Developed an interactive, data-driven explainer of the seats-votes curve, a measure of fairness in redistricting. Built with D3.
Full Stack Development
Summer 2020
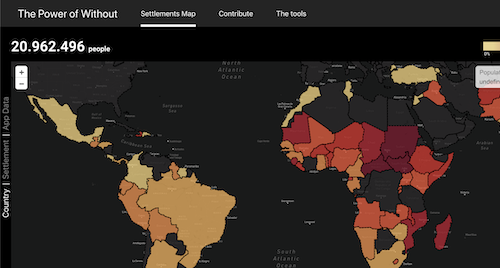
The Power of Without
Worked with the City Science Group, in the MIT Media Lab, to develop a crowdsourced data collection and visualization platform for informal settlements in developing countries. Created with Node.js and Leaflet.
Spring 2019
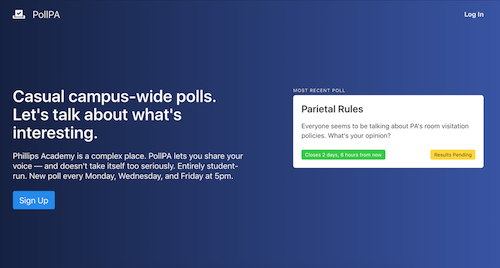
PollPA
Developed an open source, anonymous platform to poll students at my high school on important issues, in real-time. Created with R. Miles McCain, using Django and D3.